Emission Concerns: Identifying the biggest global greenhouse gas offenders
In June 2024, a new report revealed which nations were the world's worst emitters of greenhouse gases in terms of their energy production. So which countries made the list? Let's examine the research.
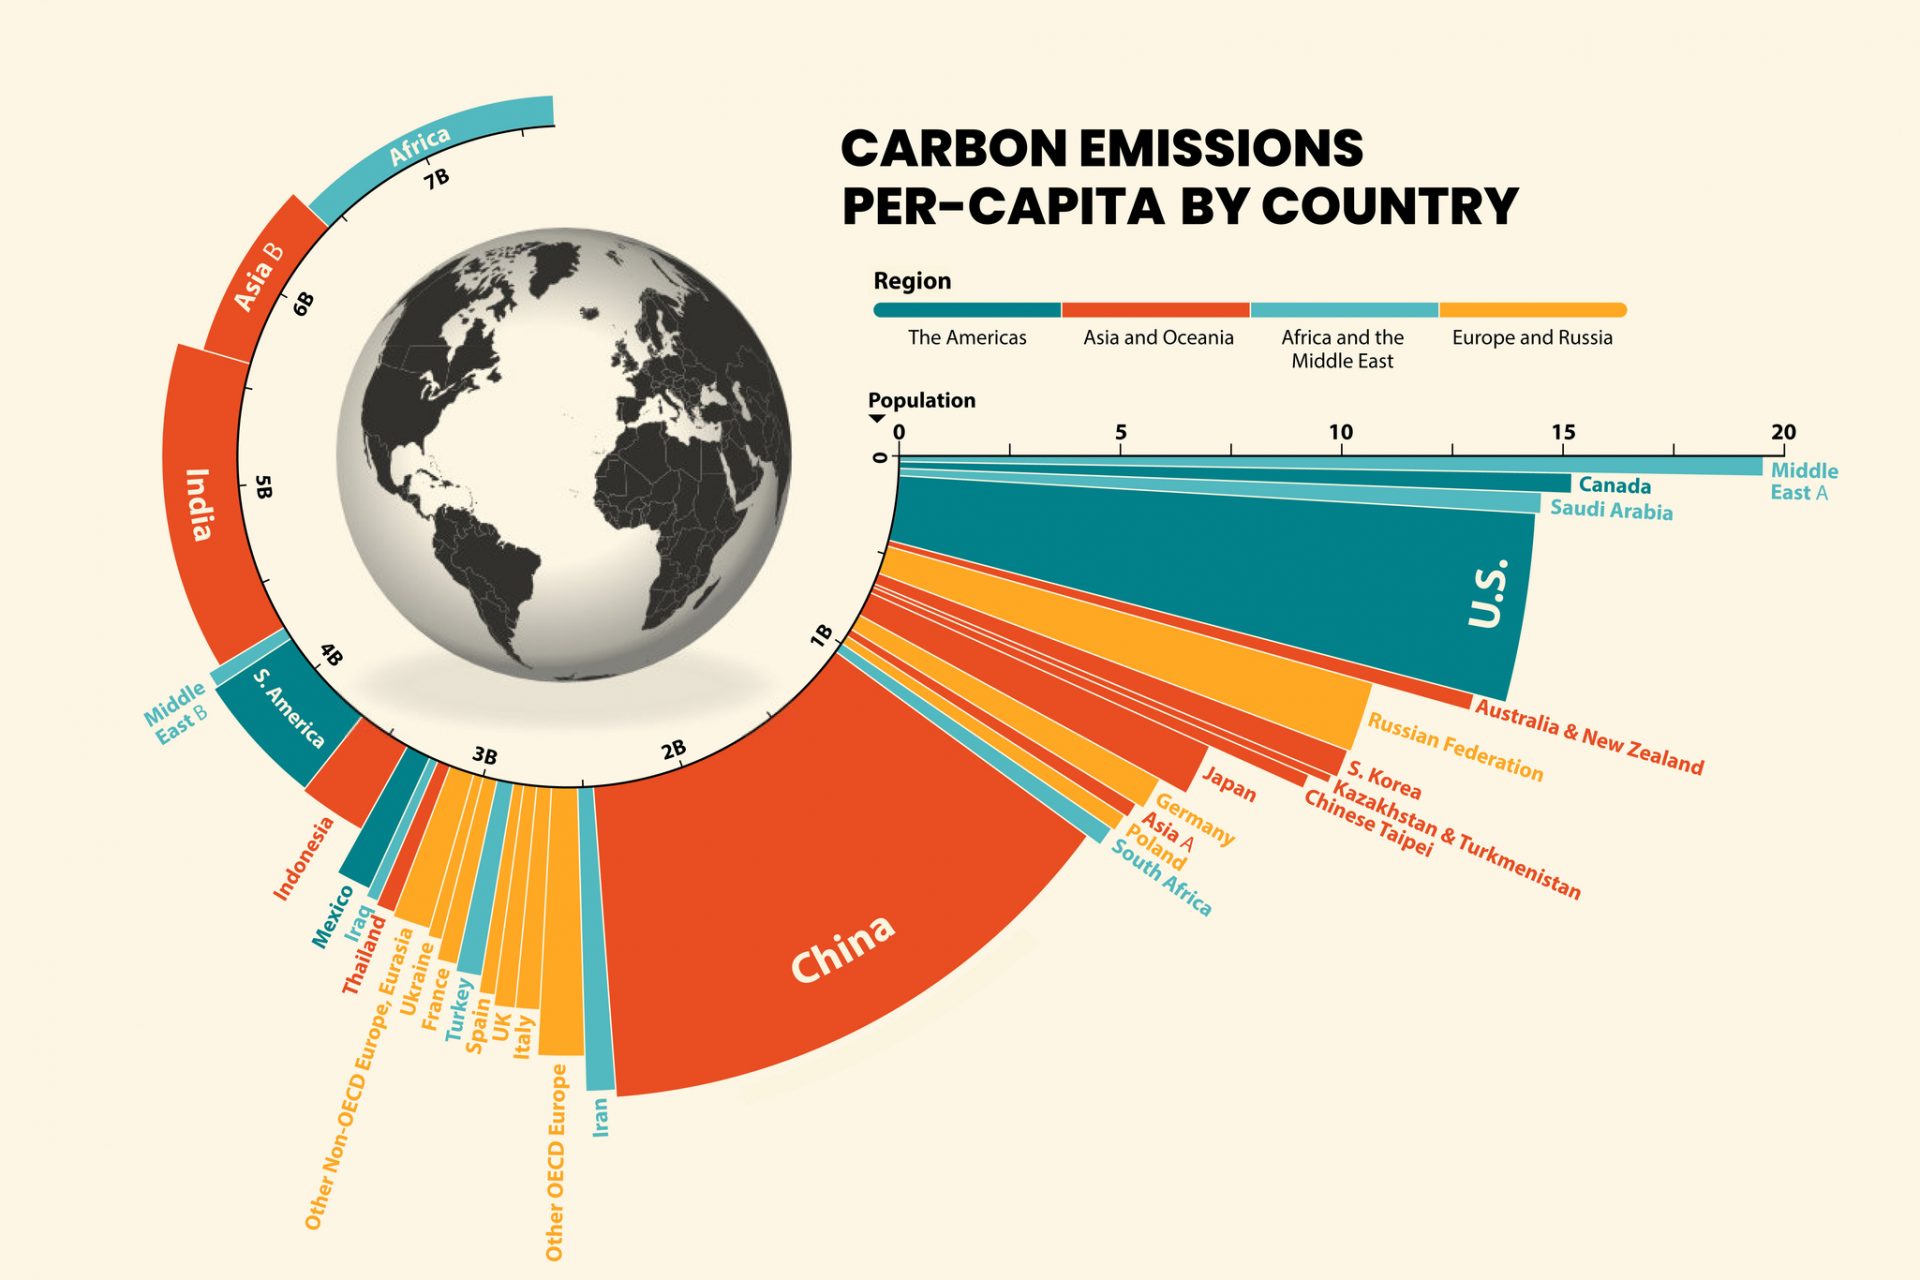
Greenhouse gas emissions are a major global problem and the energy sector is one of the biggest sources of these harmful gasses. Driven mostly by fossil fuels like oil and coal, these emissions are particularly problematic for some world powers.
The world’s worst offenders when it comes to carbon emissions derived from the energy sector are of course some of the biggest countries on Earth. However, when broken down by country, the latest data on the biggest emitters is shocking.
On June 20th, 2024, The Energy Institute published the 73rd version of its annual Statistical Review of World Energy Report and Visual Capitalist used that data to rank the world’s ten worst carbon emitters by energy production for 2023.
Before jumping into the top ten rankings, it's important to understand that the list includes “emissions from energy production, flaring, industrial processes, and the transportation and distribution of fossil fuels,” according to Visual Capitalist.
Total emissions are also represented by a measurement known as millions of tonnes of carbon dioxide equivalent (MT CO₂e), which Climate Jargon Buster explained really just allows the world’s climate researchers to compare the warming effects of various emissions.
To put the size of a ‘millions of tonnes of carbon dioxide equivalent’ into perspective, the University of Michigan noted on its website that 26 MT CO₂e is released annually by the United States just from washing clothes!
So which country is the worst offender in terms of MT CO₂e from energy production? It should be no surprise that China was number one with energy emissions of 12,603.5 MT CO₂e in 2023.
China’s energy-related emissions in 2023 were 31.6% of the global share, which was up by 6% from 2022. However, the number wasn't as surprising as some of the other countries on the top ten emitters list. Let’s look at them now.
Energy emissions (MT CO₂e) in 2023: 5,130.1
Share: 12.7
Year-over-year change: -2.7%
Energy emissions (MT CO₂e) in 2023: 3,121.5
Share: 7.7%
Year-over-year change: +9,0%
Energy emissions (MT CO₂e) in 2023: 2,176.1
Share: 5.4%
Year-over-year change: +0.5%
Energy emissions (MT CO₂e) in 2023: 1,038.6
Share: 2.6%
Year-over-year change: -6.3%
Energy emissions (MT CO₂e) in 2023: 937.0
Share: 2.3%
Year-over-year change: +1.0%
Energy emissions (MT CO₂e) in 2023: 861.5
Share: 2.1%
Year-over-year change: +1.1%
Energy emissions (MT CO₂e) in 2023: 725.9
Share: 1.8%
Year-over-year change: +0.7%
Energy emissions (MT CO₂e) in 2023: 599.4
Share: 1.5%
Year-over-year change: +0.4%
Energy emissions (MT CO₂e) in 2023: 594.2
Share: 1.5%
Year-over-year change: -3.6%
More for you
Top Stories


